“Toxic stress” has come up before in previous posts. It can occur when children are exposed to severe, frequent or prolonged traumatic experiences. Researchers refer to these events as Adverse Childhood Experiences (ACEs).
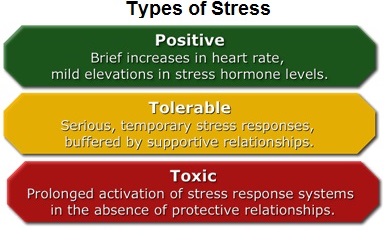
Source: Center on the Developing Child at Harvard University
When kids lack caring, protective relationships with caregivers, the stress response associated with adverse experiences can disrupt normal brain development. And the cumulative effect of toxic stress can take a toll on a person’s physical and mental health, not just in childhood but throughout life.
Toxic stress during childhood is linked it to unhealthy lifestyles later in life, such as using alcohol to cope with stress, tobacco use, and illicit drug use. A Pediatrics article also states that the “biological manifestations of toxic stress” can cause impairment of the immune system and increase risk factors for heart disease, asthma, and other health problems.
A new Child Trends report shows Oklahoma children to be especially at risk for exposure to (more…)
 The Annie E. Casey Foundation has been tracking child well-being in their annual
  Their estimates show the food insecurity rate in the U.S. is 15.9%, down from 16.4% in last year’s report. This means 48,966,000 Americans lack the resources to consistently afford enough nutritious food to live active, healthy lives.
 In 2012, in the
  For more than a century, educators have documented, studied and tried to combat summer learning loss. It has become well known that all children are prone to losing math skills during the summer, and modern studies show the loss of reading skills is also an issue, especially among children from low-income families.
 Social Security income
 Zero to Three is also one of the main sponsors behind an early learning movement called

